Why SOCAM Development Limited’s (HKG:983) Use Of Investor Capital Doesn’t Look Great

Today we'll evaluate SOCAM Development Limited (HKG:983) to determine whether it could have potential as an investment idea. In particular, we'll consider its Return On Capital Employed (ROCE), as that can give us insight into how profitably the company is able to employ capital in its business.
First up, we'll look at what ROCE is and how we calculate it. Then we'll compare its ROCE to similar companies. Finally, we'll look at how its current liabilities affect its ROCE.
What is Return On Capital Employed (ROCE)?
ROCE is a measure of a company's yearly pre-tax profit (its return), relative to the capital employed in the business. All else being equal, a better business will have a higher ROCE. Overall, it is a valuable metric that has its flaws. Renowned investment researcher Michael Mauboussin has suggested that a high ROCE can indicate that 'one dollar invested in the company generates value of more than one dollar'.
So, How Do We Calculate ROCE?
The formula for calculating the return on capital employed is:
Return on Capital Employed = Earnings Before Interest and Tax (EBIT) ÷ (Total Assets - Current Liabilities)
Or for SOCAM Development:
0.099 = HK$392m ÷ (HK$9.4b - HK$5.5b) (Based on the trailing twelve months to December 2019.)
Therefore, SOCAM Development has an ROCE of 9.9%.
View our latest analysis for SOCAM Development
Does SOCAM Development Have A Good ROCE?
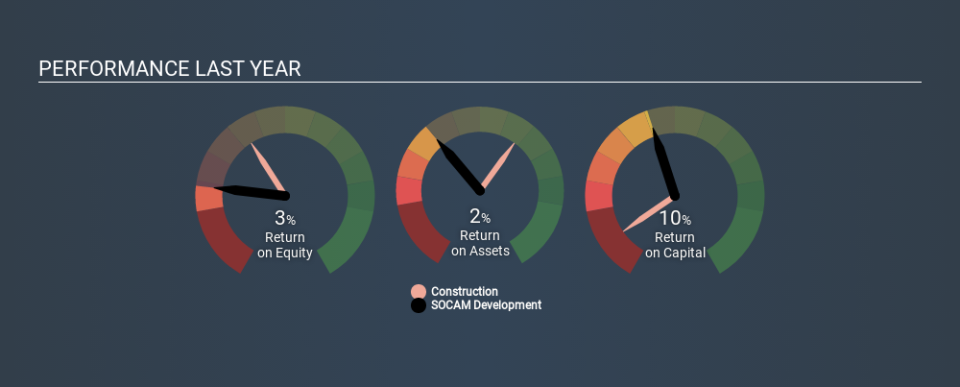
When making comparisons between similar businesses, investors may find ROCE useful. In this analysis, SOCAM Development's ROCE appears meaningfully below the 12% average reported by the Construction industry. This could be seen as a negative, as it suggests some competitors may be employing their capital more efficiently. Independently of how SOCAM Development compares to its industry, its ROCE in absolute terms appears decent, and the company may be worthy of closer investigation.
SOCAM Development delivered an ROCE of 9.9%, which is better than 3 years ago, as was making losses back then. That suggests the business has returned to profitability. You can see in the image below how SOCAM Development's ROCE compares to its industry. Click to see more on past growth.
Remember that this metric is backwards looking - it shows what has happened in the past, and does not accurately predict the future. Companies in cyclical industries can be difficult to understand using ROCE, as returns typically look high during boom times, and low during busts. ROCE is only a point-in-time measure. You can check if SOCAM Development has cyclical profits by looking at this free graph of past earnings, revenue and cash flow.
Do SOCAM Development's Current Liabilities Skew Its ROCE?
Current liabilities are short term bills and invoices that need to be paid in 12 months or less. The ROCE equation subtracts current liabilities from capital employed, so a company with a lot of current liabilities appears to have less capital employed, and a higher ROCE than otherwise. To check the impact of this, we calculate if a company has high current liabilities relative to its total assets.
SOCAM Development has current liabilities of HK$5.5b and total assets of HK$9.4b. Therefore its current liabilities are equivalent to approximately 58% of its total assets. SOCAM Development has a relatively high level of current liabilities, boosting its ROCE meaningfully.
Our Take On SOCAM Development's ROCE
The ROCE would not look as appealing if the company had fewer current liabilities. SOCAM Development shapes up well under this analysis, but it is far from the only business delivering excellent numbers . You might also want to check this free collection of companies delivering excellent earnings growth.
If you like to buy stocks alongside management, then you might just love this free list of companies. (Hint: insiders have been buying them).
Love or hate this article? Concerned about the content? Get in touch with us directly. Alternatively, email editorial-team@simplywallst.com.
This article by Simply Wall St is general in nature. It does not constitute a recommendation to buy or sell any stock, and does not take account of your objectives, or your financial situation. We aim to bring you long-term focused analysis driven by fundamental data. Note that our analysis may not factor in the latest price-sensitive company announcements or qualitative material. Simply Wall St has no position in any stocks mentioned. Thank you for reading.

